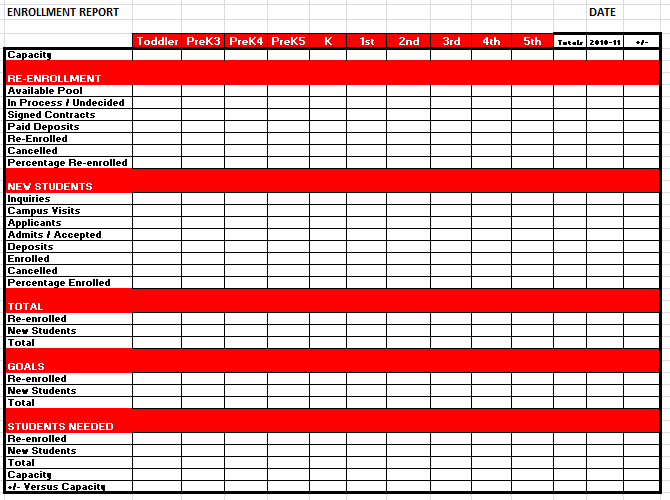
A Data-Based Enrollment Dashboard
During the next six months, school administrators will focus on their enrollment numbers as they prepare for the upcoming school year.
Budgets will be created based on these numbers. Positions and programs will be added or eliminated based on these numbers.
This data is critical for a school.
What’s surprising to me is that many schools don’t have the enrollment data they need to guide them. While they may know the number of contracts received, many of the other key data variables are missing.
School administrators need a data-based enrollment dashboard that contains a daily snapshot of their results. This dashboard should include the following:
- Admissions — Inquiries, Visits, Shadows, Applications, Admits, Deposits and Enrollees
- Retention — Available Pool, In Process, Re-Enrolled/Contracts Received, Cancelled.
In addition, these results should be shown in light of the enrollment goals. This will show the school administrator the number of students needed to reach the goals that have been established for the next year.
Recently, I helped Indian Rocks Christian School in Largo, FL, create their enrollment dashboard. They call their enrollment dashboard the “Red Report.” Their enrollment director presented the report to their school board a few weeks ago and they loved it. In this one-page report, the board knew everything they needed about the enrollment at their school.
The following is a screenshot of this enrollment dashboard. I would be glad to email you this spreadsheet if you are interested in using it at your school.

