Using an Infographic to Market your School
I still remember the focus group where a parent said that the best way to market a school is to share “real stats and real stories.” While I have written a lot about telling stories, I want to focus this post on sharing your stats as a key part of your school’s marketing strategy.
Your prospective and current parents want to know your school’s stats. They want to understand the potential return on their investment and statistics help to demonstrate this at your school.
Some of the stats that are important to parents include:
- SAT/ACT average compared to national average and local schools
- College acceptance and matriculation list (high school list for K-8 schools)
- Average scholarship dollars for college
- Testing scores and comparisons
One of the most compelling ways to communicate these stats is through an infographic.
 According to Wikipedia, “Information graphics or infographics are graphic visual representations of information, data or knowledge intended to present complex information quickly and clearly.”
In our context, an infographic is a visually compelling way to present and communicate key stats about your school.
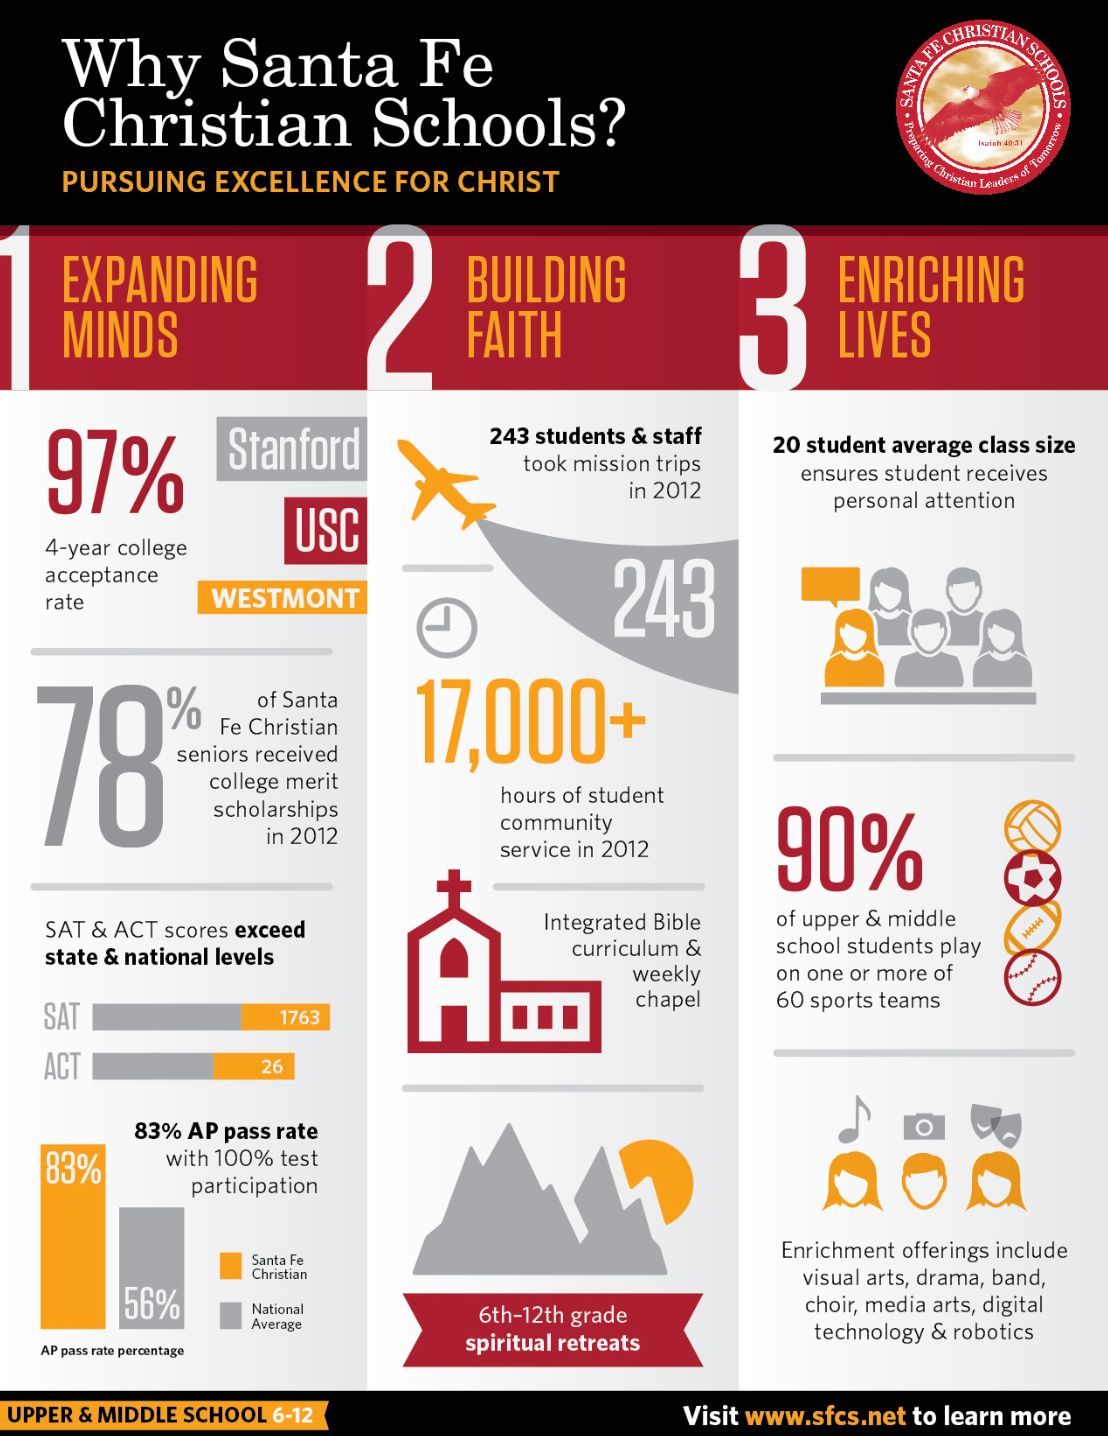
My favorite private school infographics are the ones that were recently developed by Santa Fe Christian Schools in Solana Beach, CA. They created two infographics that are available on their website homepage (on the bottom of the right hand column). One is focused on the result and stats of an education at SFCS and the other one reflects key stats from the lower school. Both are available on the SFCS website for parents to view or print.
In a guest post on SchneiderB.com, Torrey Olins shares an infographic created for Sage Hill School: Using an infographic for Independent School Marketing. This is another example of an outstanding infographic.
Recently, one of my school clients, Fredericksburg Christian Schools, created an infographic and is currently using it in their marketing effort. You can access it here: FCS Infographic.
I think an infographic should be part of your marketing strategy. It is a tool that can be used by current parents to share positive word of mouth in the community. It is also an effective and visually compelling way to showcase your key stats to prospective families.
Are you using an infographic in your school’s marketing strategy?
How are you communicating key stats about the results of your school’s program?